


TL;DR:
- Financial statements provide essential, standardized data on a company’s profitability, cash flow, and financial health.
- Reading all four core statements and their notes enables investors to identify true economic value and potential risks.
Financial statements are the primary, standardised tool investors use to assess a company’s profitability, cash generation, and balance-sheet strength before making any buy, hold, or sell decision. According to the CFA Institute, the four core statements — balance sheet, income statement, cash flow statement, and statement of shareholders’ equity — together form the foundation of rigorous investment analysis.
TL;DR — what to check first:
- Cash position and solvency: go to the cash flow statement and balance sheet first.
- Profitability and margins: start with the income statement (profit and loss).
- Liquidity warning signs: current ratio and quick ratio from the balance sheet.
- Solvency concerns: debt-to-equity and net debt from the balance sheet.
- Quality check: cross-reference operating cash flow against reported net profit.
A worked example and practical checklist appear later in this guide — skip ahead to the “Step-by-step checklist” section if you want to go straight to action steps.
Table of Contents
- What role do financial statements play in investing?
- What does the balance sheet tell you as an investor?
- How the income statement shows profitability and margin trends
- Why cash flow often matters more than accounting profit
- Notes, accounting policies, and the equity statement — what you must not skip
- How investors use financial statements: key ratios and valuation links
- Where to find UK and Singapore company filings
- Common limitations and red flags investors should watch for
- Step-by-step checklist for reading statements with a worked example
- Key takeaways
- Why reading statements changed how I invest
- Eugenechaitf’s resources for investors who want to go further
- Useful sources and further reading
- FAQ
What role do financial statements play in investing?
Financial statements are a regular “report card” for any publicly traded company. They give investors a structured, auditable view of where a business has been — how much it earned, what it owns, what it owes, and how cash moved through it. Without this data, assessing business viability is guesswork. As OpenStax’s Principles of Finance puts it, accounting is the language of business, and investors who cannot read that language are materially worse placed to judge whether a company is worth owning.

There are four core statements, each answering a different question:
| Statement | What it answers |
|---|---|
| Balance sheet | What does the company own and owe right now? |
| Income statement (P&L) | How much did it earn and spend over the period? |
| Cash flow statement | Did it actually generate cash? |
| Statement of changes in equity | How has shareholders’ ownership changed? |
The notes to the accounts and the Management Discussion and Analysis (MD&A) sit alongside these four statements. They explain the accounting policies used, disclose contingent liabilities, and give management’s own commentary on trends and risks — context the raw numbers alone cannot provide.
Companies publish statements quarterly and annually. Quarterly reports give investors a timely pulse check; the annual audited report provides the most complete and reliable picture.
Pro Tip: Don’t skip the MD&A. The SEC’s guidance describes it as management’s opportunity to show investors what the numbers show and do not show — including material risks that may not yet be visible in the figures.
What does the balance sheet tell you as an investor?
The balance sheet rests on one equation: Assets = Liabilities + Equity. Assets are what the company controls; liabilities are what it owes; equity is what belongs to shareholders after all debts are settled.
For investors, the most useful lines are:
- Current assets: cash and cash equivalents, short-term investments, trade receivables, and inventory — these reveal near-term liquidity.
- Non-current assets: property, plant and equipment (PP&E), intangibles, and goodwill.
- Current liabilities: trade payables, short-term borrowings, and the current portion of long-term debt.
- Non-current liabilities: long-term debt, lease liabilities, and deferred tax.
- Equity: retained earnings, share capital, and any treasury shares.
Three derived metrics are worth calculating immediately:
Current ratio = Current Assets ÷ Current Liabilities. A ratio below 1.0 means the company cannot cover its short-term obligations from liquid assets alone.

Quick ratio = (Current Assets − Inventory) ÷ Current Liabilities. Strips out inventory, which may be slow to convert to cash.
Debt-to-equity = Total Debt ÷ Total Equity. A rising ratio over several periods often signals increasing financial risk.
One important caveat: historical-cost accounting means assets are recorded at what the company paid for them, not what they are worth today. Savvy investors supplement book values with management commentary and industry-specific metrics to triangulate true economic value.
Pro Tip: Check the notes for off-balance-sheet items, operating lease commitments, and contingent liabilities. These obligations can materially affect a company’s true debt burden without appearing prominently on the face of the balance sheet.
How the income statement shows profitability and margin trends
The income statement runs from revenue at the top to net profit at the bottom, with several important subtotals along the way. Investors use it to judge the quality and direction of a business’s earnings.
Key line items to scan:
- Revenue: the top line; look for consistent growth and understand what drives it.
- Cost of sales (COGS): deducted from revenue to give gross profit.
- Gross profit: the first margin check — how much is left after direct production costs.
- Selling, general and administrative expenses (SG&A): operating overhead.
- Operating profit (EBIT): earnings before interest and tax; the clearest measure of core business performance.
- Net profit: the bottom line after interest, tax, and any exceptional items.
Three margin formulas investors use routinely:
Gross margin = Gross Profit ÷ Revenue × 100. A stable or expanding gross margin suggests pricing power or cost discipline.
Operating margin = Operating Profit ÷ Revenue × 100. Falling operating margins over several periods often signal cost pressures or competitive erosion.
Net margin = Net Profit ÷ Revenue × 100. Useful for cross-company comparisons within the same industry.
Watch for one-off items: large asset disposals, impairments, or restructuring charges can inflate or depress reported profit in a single period. Normalised earnings — stripping out these non-recurring items — often give a more reliable picture of underlying performance. Trend analysis matters as much as any single year’s figure; look at three to five years of data to spot direction.
Why cash flow often matters more than accounting profit
A company can report healthy net profit while simultaneously running out of cash. That gap is where the cash flow statement earns its place in any investor’s toolkit.
The statement is divided into three sections:
- Operating cash flow: cash generated by the core business — collections from customers, payments to suppliers, wages, and taxes. This is the most important section for most investors.
- Investing cash flow: cash spent on or received from long-term assets — capital expenditure (capex), acquisitions, and asset disposals.
- Financing cash flow: cash flows related to debt and equity — borrowings, repayments, share issuances, dividends, and buybacks.
Free cash flow (FCF) is the figure investors most commonly use for valuation:
FCF = Operating Cash Flow − Capital Expenditure
FCF tells you how much cash the business generates after maintaining and growing its asset base. A company with rising net profit but declining FCF deserves scrutiny: it may be recognising revenue aggressively, extending credit terms to boost sales, or building up inventory that has not yet converted to cash.
The cash flow statement is one of the most reliable fraud-detection tools available to investors, because cash flows are harder to manipulate than accrual-based earnings.
Consider a simplified example: a retailer reports £10 million net profit, but operating cash flow is only £2 million because receivables have ballooned by £8 million. The income statement looks healthy; the cash flow statement reveals a potential collection problem. That divergence is the signal.
Notes, accounting policies, and the equity statement — what you must not skip
Most investors spend their time on the three main statements and ignore the notes. That is a mistake. The notes contain disclosures that can fundamentally change how you interpret the numbers.
What accounting policies reveal:
- Revenue recognition: when and how the company books sales — aggressive recognition can inflate near-term revenue.
- Inventory costing method: FIFO versus weighted average affects reported profit margins.
- Depreciation policy: longer asset lives reduce annual depreciation charges and inflate operating profit.
What the notes commonly disclose:
- Related-party transactions that may not be at arm’s length.
- Commitments and contingent liabilities (pending litigation, guarantees) that do not appear on the balance sheet.
- Off-balance-sheet arrangements and operating lease obligations.
- Subsequent events that occurred after the reporting date but before publication.
The statement of changes in equity tracks movements in retained earnings, share capital, and reserves. Pay attention to share-based compensation charges (which dilute existing shareholders) and treasury share buybacks (which can flatter earnings per share).
Pro Tip: When you spot an unusual item in the income statement — a large gain on disposal, say — go straight to the relevant note. The note will tell you whether it is genuinely one-off or likely to recur, and whether the auditors raised any concerns about the valuation.
The SEC’s guidance is explicit: combining the MD&A with the financial statements gives investors the most complete picture of a company’s condition and management’s own assessment of its prospects.
How investors use financial statements: key ratios and valuation links
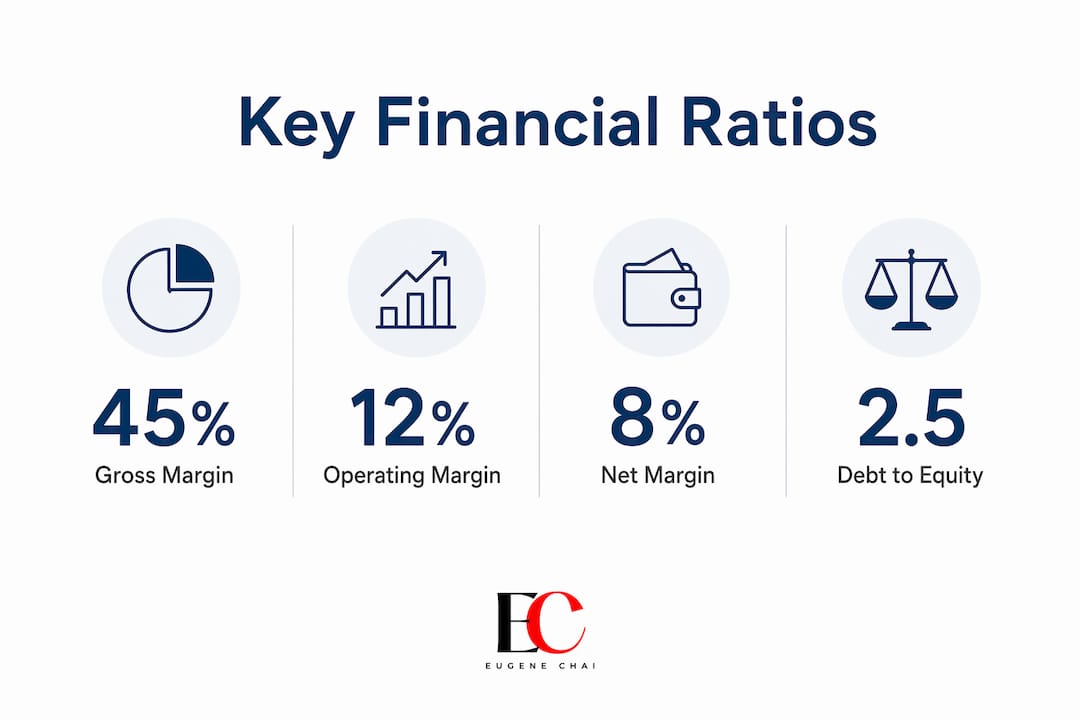
Ratios are the practical tools that turn raw statement figures into comparable signals. Investors use ratios such as return on equity and gross margin to compare performance between companies in the same industry and to judge whether a business is generating returns that exceed its cost of capital.
Key ratio reference table
| Category | Ratio | Formula | What to watch for |
|---|---|---|---|
| Profitability | Gross margin | Gross Profit ÷ Revenue | Stable or rising trend |
| Profitability | Return on equity (ROE) | Net Profit ÷ Shareholders’ Equity | Compare to sector peers |
| Profitability | Operating margin | EBIT ÷ Revenue | Falling margin = cost pressure |
| Liquidity | Current ratio | Current Assets ÷ Current Liabilities | Below 1.0 is a warning |
| Liquidity | Quick ratio | (Current Assets − Inventory) ÷ Current Liabilities | Below 1.0 merits scrutiny |
| Solvency | Debt-to-equity | Total Debt ÷ Total Equity | Rising trend = increasing risk |
| Solvency | Net debt | Total Debt − Cash | Negative = net cash position |
| Efficiency | Asset turnover | Revenue ÷ Total Assets | Declining = less productive assets |
Ratios work best in combination. A constructive signal typically looks like: rising revenue + expanding operating margins + positive and growing FCF + manageable net debt. Any single ratio in isolation can mislead.
Valuation links: statement figures feed directly into common valuation models. FCF is the primary input for discounted cash flow (DCF) analysis. Earnings per share (EPS) drives price-to-earnings (P/E) multiples. Book value per share underpins price-to-book (P/B) comparisons. The quality of those inputs determines the reliability of any valuation output.
Pro Tip: Before plugging figures into a valuation model, normalise earnings by removing non-recurring items. A single large write-off can depress EPS dramatically in one year, making a P/E ratio look misleadingly high. Use a three-year average of normalised earnings where possible.
Where to find UK and Singapore company filings
Knowing where to look is half the battle. Official sources are always preferable to third-party aggregators, which may carry outdated or incomplete data.
For UK-listed companies:
- Companies House (gov.uk/companies-house): all UK-registered companies must file annual accounts here; searchable by company name or number.
- London Stock Exchange Regulatory News Service (RNS): listed companies publish results announcements, annual reports, and interim reports here in real time.
- Company investor relations pages: the most complete source, including presentations, webcasts, and supplementary data packs.
For Singapore-listed companies:
- SGXnet (sgx.com): all SGX-listed companies file announcements, annual reports, and quarterly updates here.
- ACRA BizFile+ (bizfile.gov.sg): financial statements for Singapore-incorporated companies.
- Company investor relations pages: as with UK companies, these often contain more detail than the regulatory filing alone.
For US comparatives: the SEC’s EDGAR database (sec.gov) hosts 10-K annual reports, 10-Q quarterly filings, and 8-K current reports for all US-listed companies.
As FINRA notes, regulatory filings differ by market, and investors should use official registries to confirm the completeness and authenticity of any filing they rely on.
Pro Tip: The annual audited report and the interim (half-year or quarterly) report serve different purposes. The annual report carries a full independent audit opinion; interim reports are typically reviewed, not audited, and carry a higher risk of later revision. Weight the annual figures more heavily when making long-term decisions.
Common limitations and red flags investors should watch for
Financial statements are backward-looking by design. They record what happened, not what will happen. The CFA Institute is clear that statements are starting points and must be combined with qualitative research and industry context before any investment conclusion is drawn.
Key limitations:
- Historical cost accounting may understate or overstate asset values relative to current market prices.
- Managerial estimates (useful life of assets, bad debt provisions, pension assumptions) introduce subjectivity.
- Non-GAAP or non-IFRS metrics presented by management may exclude legitimate costs.
- Statements reflect one company at one point in time — without industry benchmarks, the numbers mean little.
Red-flag checklist for investors:
- Revenues growing faster than cash collections (receivables rising sharply).
- Inventory building up while sales growth slows.
- Operating cash flow consistently below reported net profit over multiple periods.
- Frequent restatements of prior-period figures.
- Large or recurring “one-off” charges that appear every year.
- Significant related-party transactions without clear commercial rationale.
- Auditor qualifications, emphasis-of-matter paragraphs, or a change of auditor.
- Rapid growth in goodwill from acquisitions without corresponding cash flow improvement.
No single red flag is automatically disqualifying, but two or more appearing together warrant deeper investigation before committing capital.
Step-by-step checklist for reading statements with a worked example
A reproducible workflow prevents you from getting lost in the numbers. Use this three-pass approach.
Three-pass reading workflow
- First pass — quick screen: check revenue trend (three years), operating cash flow sign (positive or negative), and net debt level. If all three look broadly healthy, proceed.
- Second pass — ratio checks: calculate gross margin, operating margin, current ratio, debt-to-equity, and FCF. Compare to prior periods and sector peers.
- Third pass — quality checks: read the MD&A, review key accounting policies in the notes, check for related-party disclosures, and verify that operating cash flow aligns with reported profit.
- Valuation inputs: extract normalised EPS, FCF, and book value per share for use in P/E, DCF, or P/B models.
Worked example: Company A (illustrative figures)
| Metric | Year 1 | Year 2 | Year 3 |
|---|---|---|---|
| Revenue | — | — | £100m |
| Gross profit | — | — | £42m |
| Operating profit (EBIT) | — | — | £16m |
| Net profit | £8m | — | £10m |
| Operating cash flow | £11m | — | £15m |
| Capital expenditure | £3m | £4m | £4m |
| Shareholders’ equity | — | — | £52m |
Calculated ratios (Year 3):
- Gross margin: £42m ÷ £100m = 42% (stable, slight improvement from 42.2% in Year 1)
- Operating margin: £16m ÷ £100m = 16% (rising from 15% in Year 1 — positive trend)
- FCF: £15m − £4m = £11m (growing and well above net profit — quality signal)
- ROE: £10m ÷ £52m = 19.2% (strong; compare to sector cost of equity)
The combination of rising margins, FCF exceeding net profit, and improving ROE points to a constructive picture. A next step would be to check the balance sheet for debt levels and review the MD&A for any disclosed risks before forming a view.
Key takeaways
Financial statements are the primary, standardised tool investors use to assess profitability, cash generation, and balance-sheet strength, and reading all four statements together — not just the headline profit figure — is what separates informed investment decisions from guesswork.
| Point | Details |
|---|---|
| Use all four statements together | No single statement tells the full story; combine balance sheet, P&L, cash flow, and equity changes. |
| FCF over net profit | Free cash flow (operating cash flow minus capex) is a more reliable measure of business quality than reported earnings. |
| Ratios need context | Compare ratios to prior periods and sector peers; a current ratio of 1.2 means different things in retail versus software. |
| Notes and MD&A are not optional | Accounting policies, contingent liabilities, and management commentary often explain what the numbers alone cannot. |
| Eugenechaitf as a learning resource | Eugenechaitf’s investment guides and worked examples help you practise applying these principles to real company reports. |
Why reading statements changed how I invest
Most beginner investors focus almost entirely on the share price and the headline earnings number. I did the same early on. The shift came when I started reading the cash flow statement alongside the income statement and noticed that a company I was considering had reported three consecutive years of profit growth while its operating cash flow was flat. The receivables balance had quietly doubled. That divergence, visible only by comparing the two statements, was enough to pause and investigate further — and the subsequent annual report confirmed a revenue recognition issue that led to a restatement.
The lesson I took from that experience is straightforward: the income statement tells you what management wants you to see; the cash flow statement tells you what actually happened in the bank account. Reading both together, every time, is the single habit that has most improved my investment process.
For anyone building this skill from scratch, I’d recommend starting with real annual reports from SGX-listed companies you already know as a consumer. Familiarity with the business makes the numbers easier to interpret. The financial literacy fundamentals guide on this site is a good place to anchor the concepts before you open your first annual report.
Eugenechaitf’s resources for investors who want to go further
If you’ve worked through this guide and want to put the framework into practice, Eugenechaitf’s investment tips and strategies section is built for exactly that next step. It covers how to apply ratio analysis to specific asset classes, how to screen SGX-listed stocks using publicly available filings, and how to connect statement analysis to your broader financial goals.

Whether you’re a young adult opening your first brokerage account or a working professional reviewing your portfolio, the site’s step-by-step guides walk you through the process without assuming prior accounting knowledge. The goal is to make financial statement analysis feel less like a chore and more like a genuine edge.
Visit the investment resources page to explore beginner-friendly guides, ratio checklists, and worked examples you can apply to real company reports today.
Useful sources and further reading
These authoritative sources are worth bookmarking for ongoing reference:
- SEC Beginners’ Guide to Financial Statements: clear plain-English explanations of all four statements and the MD&A; ideal for building foundational understanding.
- CFA Institute — Introduction to Financial Statement Analysis: practitioner-level reading on ratio analysis, comparability issues, and how statements feed valuation models.
- FINRA — Using Financial Statements to Evaluate Investment Opportunities: investor-focused guidance on reading reports and locating official filings.
- AccountingTools — Purpose of Financial Statements: concise reference for definitions and the role of each statement.
- OpenStax Principles of Finance: free textbook covering financial literacy and accounting fundamentals.
- SGXnet (sgx.com): official source for all SGX-listed company announcements and annual reports.
- Companies House (gov.uk/companies-house): UK company filings database, free to search.
- Eugenechaitf — Investment guides: Singapore-focused articles applying these principles to local markets and SGX-listed companies.
- Arizona Christian Homeschools — Financial literacy resources: a structured financial literacy curriculum for those who prefer a guided learning path.
Disclaimer: Informational only. Consult an MAS-licensed advisor before investing.
FAQ
What is the purpose of financial statements for investors?
Financial statements give investors standardised, auditable data on a company’s profitability, cash generation, and financial position, forming the basis for buy, hold, or sell decisions. The CFA Institute describes them as the primary source of data for evaluating profitability, liquidity, and solvency.
What is the role of financial statements in investment decision-making?
Investors use the four core statements together to assess whether a business is profitable, cash-generative, and financially sound enough to justify the asking price. No single statement tells the complete story — the balance sheet, income statement, and cash flow statement must be read in combination.
Why do investors care about cash flow more than profit?
Reported profit can be influenced by accounting estimates and revenue recognition choices, whereas cash flow is harder to manipulate. A company with strong net profit but weak operating cash flow may be recognising revenue prematurely or struggling to collect from customers.
Where can UK investors find official company filings?
UK investors can download annual accounts from Companies House and view listed-company results announcements on the London Stock Exchange’s Regulatory News Service (RNS). Singapore investors should use SGXnet for SGX-listed filings and ACRA BizFile+ for company accounts.
What are the biggest red flags in financial statements?
The most common warning signs include operating cash flow that consistently falls below reported net profit, rapidly rising receivables or inventory, frequent restatements, and large recurring “one-off” charges. Two or more of these appearing together in the same set of accounts warrants careful investigation before investing.






Leave a Reply